© 2026 ALLCITY Network Inc.
All rights reserved.


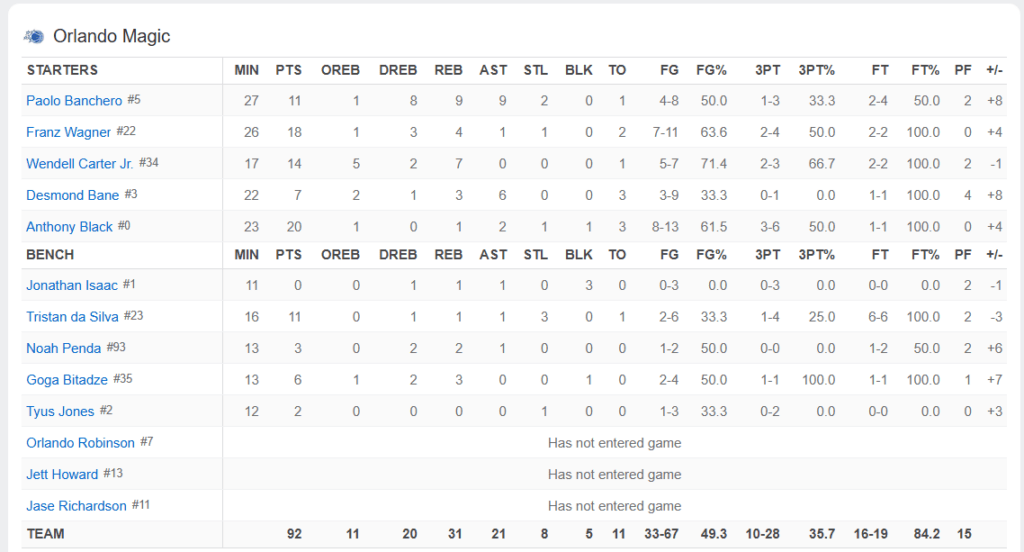
The main controversy we’ve had this NBA season, gauged by the inconvenience it caused me, a foolproof method we can all agree on, was ESPN changing its box score format. To start this season, anyone with a box score checking habit too ingrained to change websites was presented with ESPN’s new display, which moved points next to minutes, pushed percentages to the end, and generally rejiggered the entire thing into an incomprehensible mess. It was an outrage. Just look at this monstrosity:
For about a month, this went on. Every time I clicked on a box score, this jump scare awaited, forcing existential questions like, “What is a box score, anyway?” And yet, time and time again, I went back out of habit, a shameful proof I was no better than the lab rats who love cheese. I have uses for nearly every stats website; there are some numbers that require Basketball Reference, some that need RealGM, some best found on niche websites like pbpstats.com. But box scores, damnit, have always been meant for ESPN. It’s just, for me, how it’s always been.
Sometimes, thankfully, truly bleak stories like these end up having heroes. This one’s was Tim Legler, our beloved cohost of the ALL NBA Podcast, who was the first of several podcasters and journalists to righteously rail against these changes. As Legler said, “Why did they do it?! Why do I have to go all the way across the page to find out what players shot from the field?!” And those questions, correct and pertinent, haunted me, as well.

Legler’s pleas worked, and ESPN soon after reverted its box score to the old format. Legler, naturally, was hailed as a hero: Once again, it was possible to survey both points and field goal percentage in the same glance. According to his ESPN player page, Legler shot 43.1 percent on 3-pointers throughout his 10-year career. In my eyes, though, he has never missed.
But this led me back to that hyperbolic question: What is a box score? And, naturally, another more sinister one: How could we make one that’s even worse?
What is a box score, anyway?
Harvey Pollack is credited with the modern box score. He was a sportswriter and then a public relations official for the Philadelphia Warriors of the Basketball Association of America, which merged with the National Basketball League in 1949 to create the National Basketball Association, the one we know today, and remained employed by Philadelphia until his death in 2015. As Pollack once told the Philly Inquirer, “When I started, the box score was field goals, foul shots made, foul shots attempted, personal fouls and points. That was it.” Pollack kept score for Wilt Chamberlain’s 100-point game and was responsible for the ‘100’ sign that Chamberlain held up after to create one of the league’s most iconic images.
Oh, if only Pollack knew what was to come. These days, every column can be bet on, ‘box score watcher’ is a pejorative against the ‘number nerds’, and subscription websites like Cleaning the Glass can charge users for an enhanced variation. There’s so much focus on the box score that the NBA introduced the heaves rule this year. Too many players weren’t taking those 50-foot potshots because they were scared of, yes, the box score. And don’t you dare change how it looks, or we’ll riot.
Here’s my box score perusal methodology: Whenever I open up a random box score, specifically one from a completed game, the first looks goes to who scored. For a quick-and-dirty efficiency test, measure their attempted shots against their total points. Next, check the 3-pointers column. It’s an easy way to spot randomness; sometimes, one team may just hit its jumpers that its opponent doesn’t. This season, for example, teams are 95-39 when hitting at least five more 3s than an opponent; they’re 98-26 when shooting at least 10 percent better from the 3-point line. Especially for surprising results, it’s worth noting any extreme variance. The only column more results-predictive than the 3-point one is points.
After that, the most indicative stats are possession-based ones: Who turned it over more?; who had more offensive rebounds?; who earned more free throws? But to do that quickly, just look and see which team took more field goal attempts. It’s not nearly as predictive — teams with at least 10 more attempts are just 79-66 this year — but it often encapsulates these numbers in one swing. It might also just show which team drew more whistles but, thankfully, there’s an easy way to check.
There are other things that matter that the box score can’t communicate, most notably pace, and it isn’t any substitute for watching actual games, of course. But we needed to go through this to understand how I plan to create the league’s worst box score. I need you to understand which parts are valuable, which parts aren’t, and how I plan to fully strip away any order or usefulness from our beloved spreadsheet.
Let’s make the worst ever box score
This isn’t about glitches, but they helped inspire them. When ESPN reverted its box scores to the old format, I suspect it interfered with a browser plug-in I use, which created this ghastly image. It only looked like this for one night, but it still haunts me.
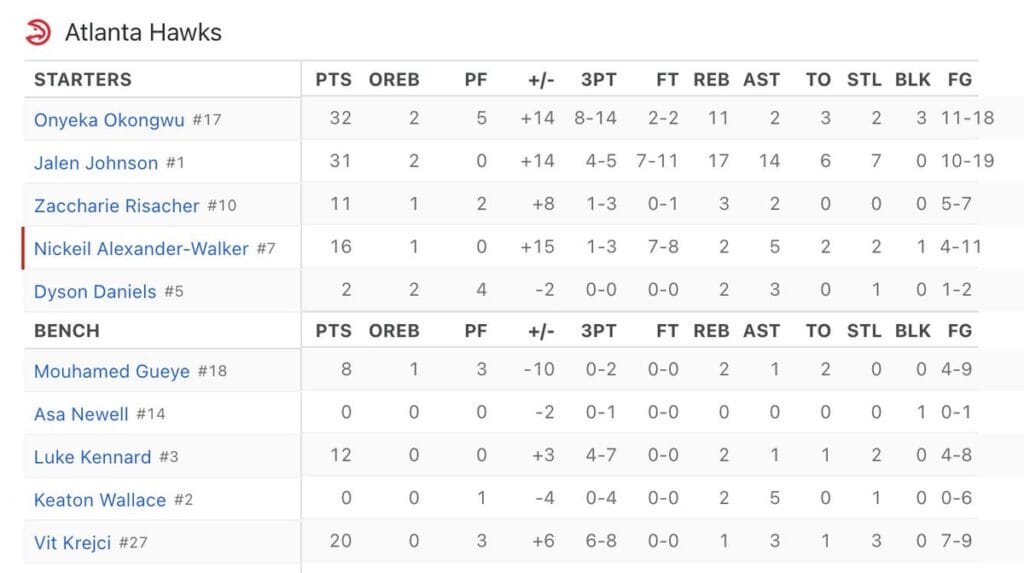
Then, last week, there was another instance where a box score didn’t scale correctly to a skinny browser window. It amused me, but this was my own doing.
No, we want to make a perfectly functional box score with most of the typical stats. We just want to make it truly horrific.
Our father of box scores, Pollack, is credited as being the first person to record rebounds separately as offensive and defensive ones. There’s a common box score perusal mistake that I see fans make all the time, ones where they assign blame for a blowout loss to the rebounding margin, forgetting that defensive rebounds are a stats that can only be accrued when defenses are forcing missed shots. It is an indicative statistic: Teams are 80-25 when winning the rebounding margin by at least 10 this season. But total rebounds is a statistic that often steals valor from the good offensive or defensive performance that allowed those margins. It could indicate better rebounding was a factor in the result, but there’s no way to tell from the totals. If you must, comparing offensive rebounds is a better metric.
So, with apologies to Pollack, let’s stop separating rebounds again. Or, even better, let’s remove only the offensive rebounding column. Box scores already choose not to separate 2-point attempts from total field goals; you can still calculate it, but only with some mental math. To get the more valuable number of offensive rebounds, I’m going to make you do the same.
I grabbed the Denver Nuggets’ box score from Sunday’s 115-106 win against the Charlotte Hornets. This will be what I mutilate. So far, it’s looking alright.

Another overrated box score check is assist-to-turnover rate, at least in the sense it provides little context about a player’s performance that night. Assists can be wonky and inconsistent, turnovers aren’t necessarily passing mistakes, and a heliocentric player tallying five giveaways doesn’t mean his team had or has a turnover problem no matter how gaudy that number looks.
I don’t care. We’re trying to create something evil here. We’re going to replace both assists and turnovers with assist-to-turnover ratio. If a player’s ratio is two, have fun figuring out if it was two assists and a turnover or eight and four.
Also, let’s change minutes to minutes per 48 minutes. I considered adding other minutes-adjusted stats; minutes per 48 minutes was the least disruptive. It’s worth knowing how any given players’ minutes would scale to an entire game.
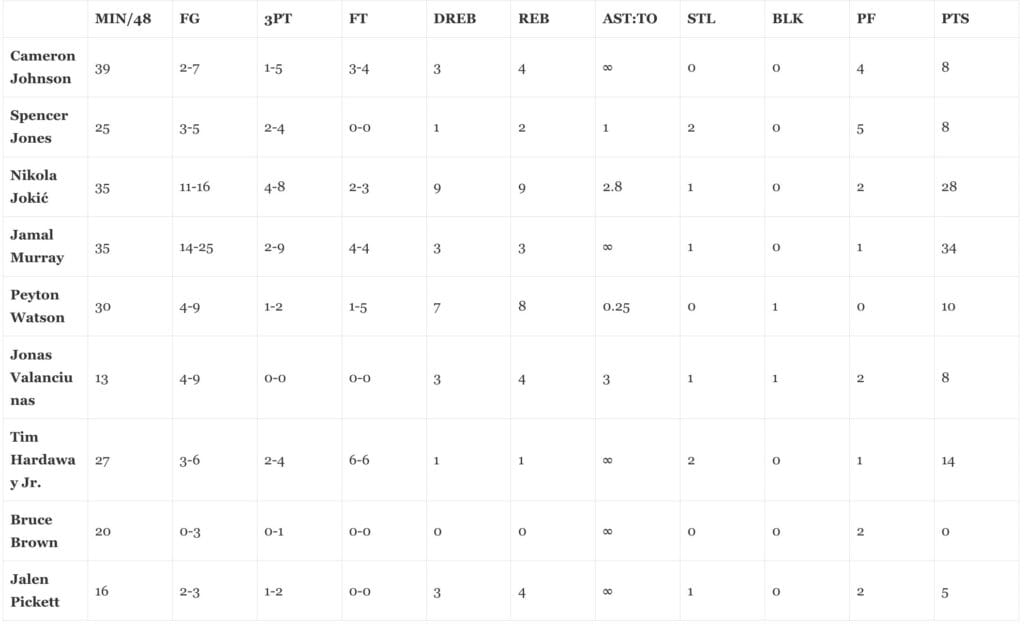
We’ve unfortunately got some players with an infinite assist-to-turnover ratio, but that’s just how the math works. If you’re wondering, Louis King’s 2021-22 season for the Sacramento Kings was the most minutes anyone has ever played with an infinite assist-to-turnover ratio: He tallied nine assists and zero turnovers in 104 minutes. More shocking is that Louis King wasn’t a player from the ’80s, but that’s besides the point. He even attempted 45 shots that season without once coughing it up.
In the analytics space, they’re combining steals and blocks more than ever before, calling them stocks. It provides a better sense of a player’s general defensive disruption and removes those pesky instances where swipe downs are recorded as blocks despite feeling like steals. I’m all for combining them. But wait: A player could poke away a loose ball, swim around that player, dive onto the floor, and happen to be touching out of bounds when he swallows it up. That wouldn’t even be recorded in the basic box score or play-by-play data in any meaningful way. Why shouldn’t we chart deflections, too? We’ve just freed up another column. Surely the fact that deflections almost perfectly correlate to steals — for every two deflections, a player earns about one steal — shouldn’t mean we choose not to include this stat in its messier form.
Since we can get deflections from an obscure tab on the NBA’s stats page, we’ll add those, too.
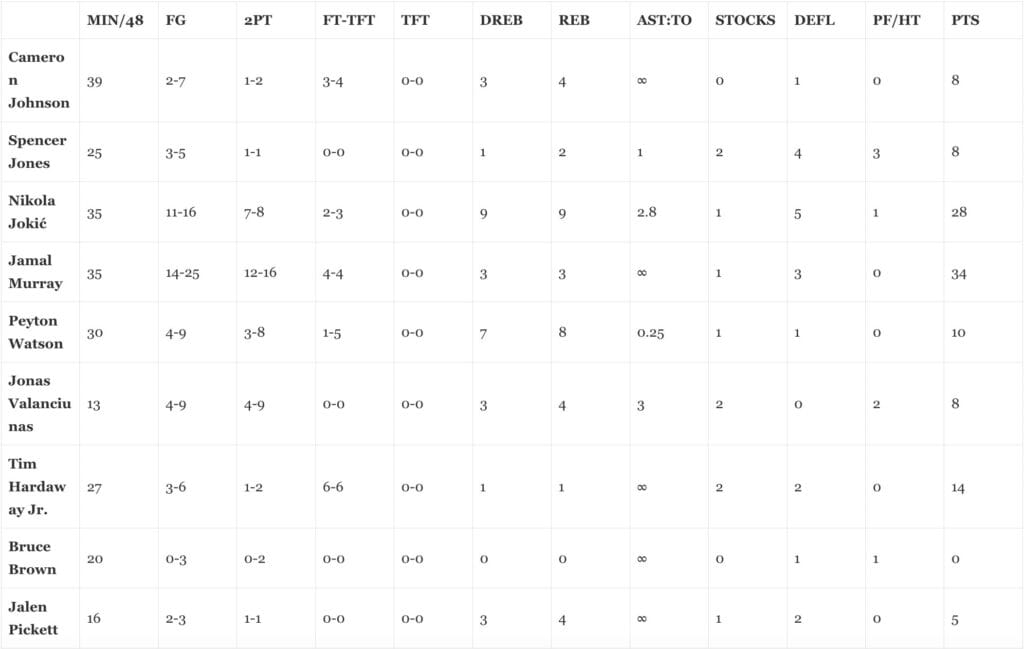
Also, remember that rough efficiency test? Whether a player scored more than he attempted shots? That’s justified because earning free throws is a type of shooting possession; star players often supplement poor shooting nights with free throws. But flagrant fouls and technical free throws sometimes provide stars extra points that had nothing to do with them earning it. Let’s separate free throws taken in those instances from the total number. Here’s our box score’s next rendition.

While the Nuggets did not attempt any technical or flagrant free throws in Sunday’s game, it’s nevertheless good to know that none of their points were inflated. This has probably been this box score’s most important addition thus far.
Fouls can be misleading. Someone can commit two intentional ones in the final minute of a game, foul out, and yet never sat for a minute due to foul trouble. The same can apply to a star who has a low-minute first half by picking up three quick ones only to coast through the rest of the game unpenalized. To get a better sense for if foul trouble affected a player’s evening, we best change that to personal fouls at halftime.
Now let’s change 3-pointers to 2-pointers. It’s too useful and predictive a stat for this Frankenstein we’re creating. We’re just giving it the same treatment that box scores everywhere have given 2s for decades.
I’m tempted to add the number of jumps each player had each game. Peyton Watson led Denver with 44, if you were wondering, while Bruce Brown finished with just 12. I can’t find any indicative correlations for the number of jumps and the results, though, so we’ll leave it out. The same goes for falls. Yes, as in, the number of times that a player fell the ground. Tim Hardaway Jr. had three, but Brandon Miller’s four were a game high. But we’ll leave those out.
I think we’ve done a good job with these statistics and columns. The only thing we have left to do is to scramble it in the least pleasant possible manner, which I’ll do with delight. Here’s our beloved mutation; those mental math columns cannot exist next to each other.
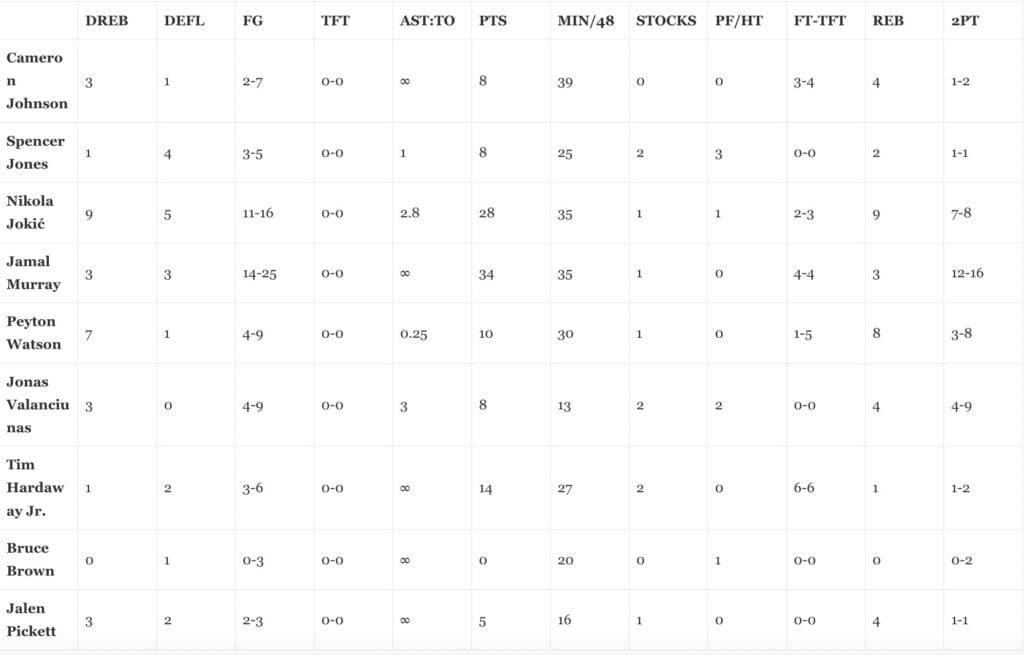
Every single statistic offered in a traditional box score, assuming you turn over the ball at least once to avoid an infinite ratio, is technically still available in this reformed version. (And, I suppose, second half fouls, but when have those ever been important.) We’ve even added deflections as a truer way to track disruption, never mind that the current steals statistic was doing just fine at that. And now you’ll never again wonder if Nikola Jokić, and his four-of-four shooting night from the line, benefitted from shots he didn’t earn from drawing shooting fouls. I just checked the technical free throw column. He didn’t take any in Sunday’s game.
I’d like to sincerely apologize to the Denver Nuggets, Tim Legler, and Harvey Pollack for this experiment. ESPN, please do not read this.
Comments
Share your thoughts
Join the conversation

The Comment section is only for diehard members
Scroll to next article
Don't like ads?
Don't like ads?
